Methodology
-
Framework and Indicator Development
We relied on a number of different sources of information and feedback in developing and finalizing our framework and indicators:
- Previous extensive experience developing performance measures and collecting data in the United States and internationally, including in post-conflict and data-poor countries
- Thorough review of the literature and existing indices in the United States and internationally
- Exploratory analyses of citywide data sources and reporting mechanisms
- Written feedback from U.S. and international experts on equality and performance indicators
- Three citywide community meetings
- Suggestions from the Mayor’s Office of Operations on what to measure and how to access data
- Testing of the indicators to verify their merit and feasibility
-
Data Sources
The data for the indicators came from three different types of sources: administrative data, primary survey data, and secondary survey data.
Administrative data collection involved obtaining data maintained by City, State, and Federal government agencies, not-for-profit organizations, and research and academic institutions. Some of these data were publicly available, provided on agency/organization websites, the NYC Open Data Portal, the Mayor’s Management Report, or NYC Citywide Performance Reporting. The remainder of the administrative data were provided by the relevant agency or organization upon request.
ISLG public survey data collected as part of an annual survey of 3,000+ NYC residents age 18 and older each summer using a multi-modal methodology, which includes automated phone calls to landline telephones, live phone calls to cellular telephones, and in-person interviews. The survey consists of a combination of closed-ended and one open-ended questions. It also includes demographic questions to enable comparisons.
Secondary public survey data collection involved gathering data from annual public surveys currently conducted by government agencies and other organizations. These surveys included the American Community Survey, Current Population Survey, NYC School Survey, and Community Health Survey.
-
Scoring
Types of Scores
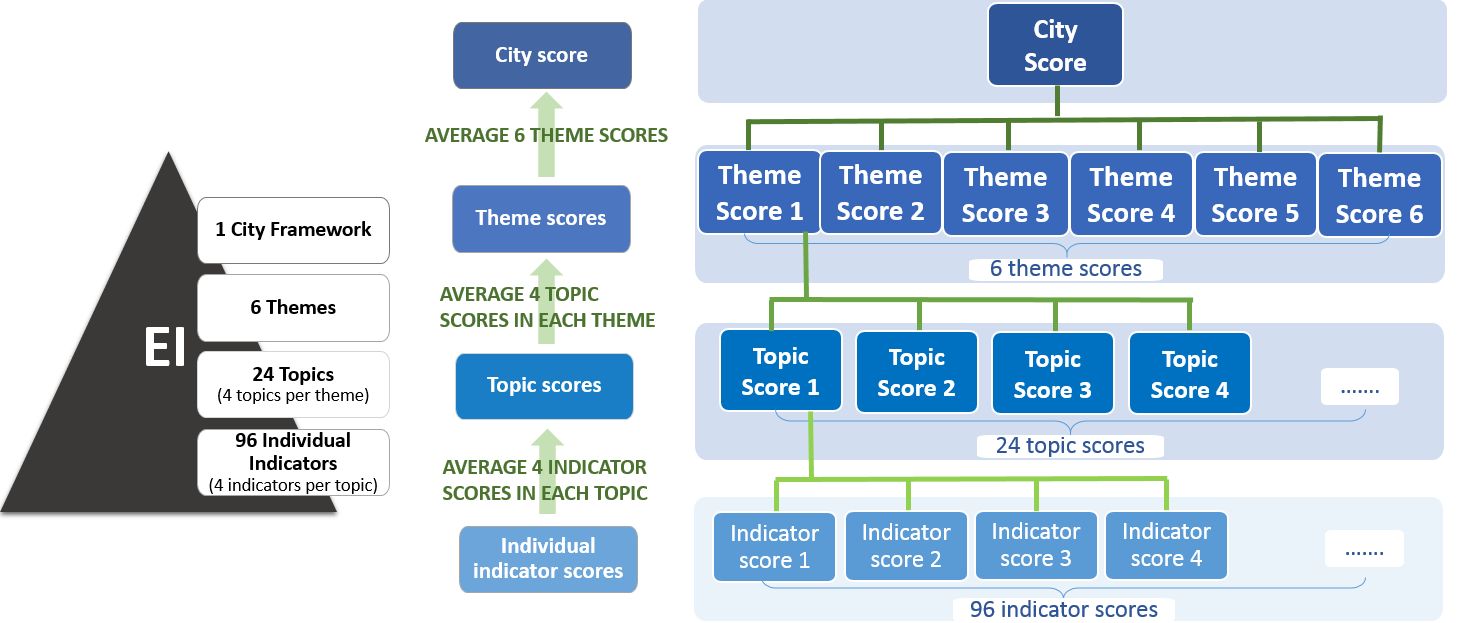
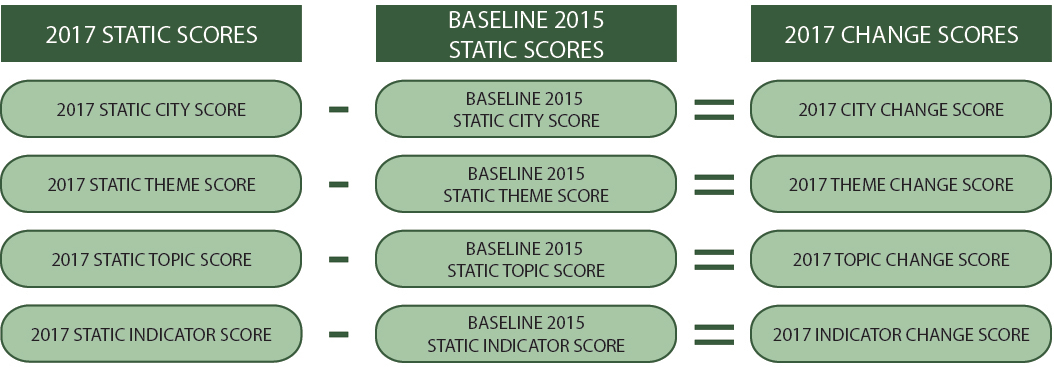
The Equality Indicators are designed to be scored in two ways. Static Scores capture findings for a given year; and Change Scores capture change from one year to the next. In addition to these scores, each indicator description includes raw data and narrative summaries useful for contextualizing these quantitative findings.
Static Scoring
Each of the 96 indicators is scored on a scale from 1 (highest possible inequality) to 100 (highest possible equality). These scores are calculated using one of three possible measures:
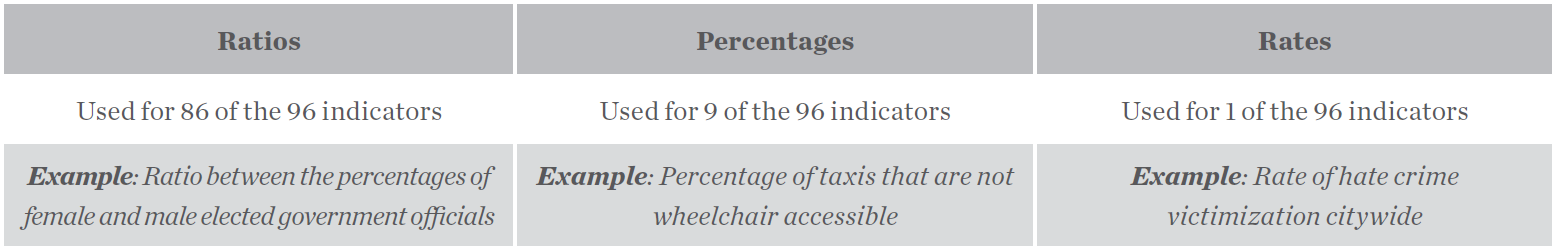
For indicators based on ratios, scores are calculated in the following way:
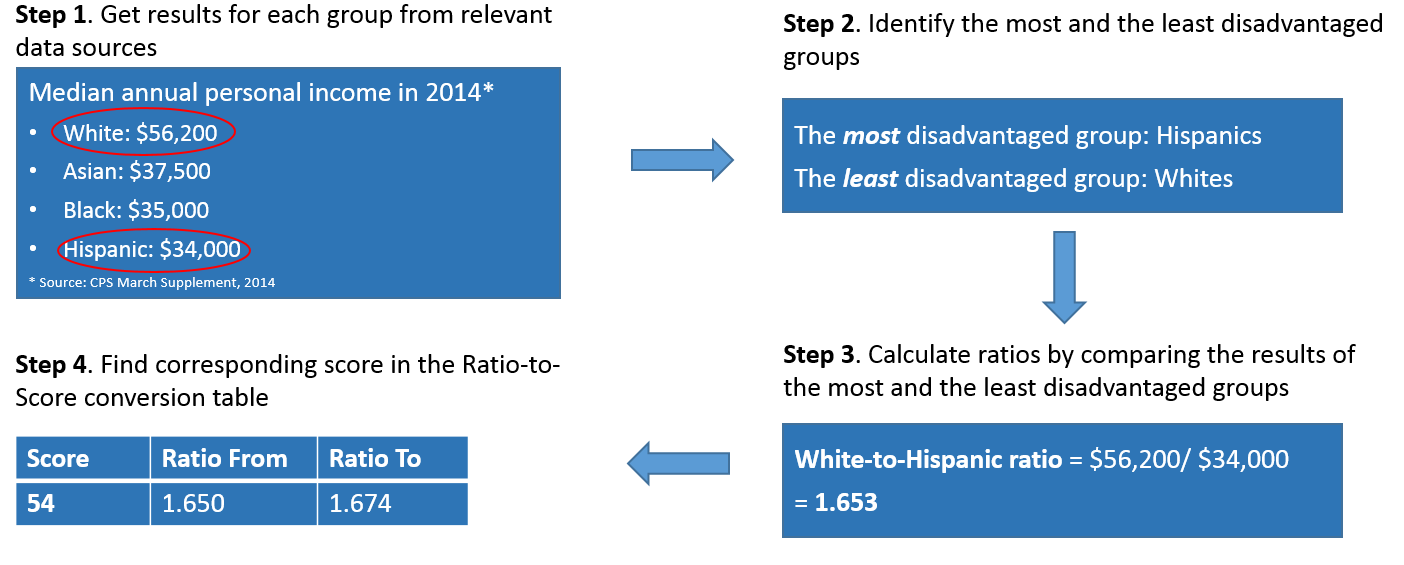
Click here to see the ratio-to-score conversion table.
For the 9 indicators expressed as percentages and the one expressed as a rate (rate of hate crime victimization), scores correspond with actual percentages or rate.
Scores at higher levels are calculated using averages as follows:
Change Scoring
Change scores are calculated by subtracting the baseline year’s score from the current year’s score:
-
Methodological Notes
ISLG Public Survey Technical Notes
2017
Survey respondents were 3,177 NYC residents aged 18 and older. The survey was conducted from August 5 – August 21, 2017 using a multi-modal methodology, which included IVR (automated) phone calls to landline telephones, live phone calls to cellular telephones, and in-person intercept interviews.
The margin of error for the overall sample is +/- 1.74%. The margin of error by borough is as follows:
- Bronx +/- 4.2%
- Kings +/-3.1%
- New York +/- 4.0%
- Queens +/- 3.4%
- Richmond +/- 7.1%
The completion rate for the surveys fielded by IVR calls was 1.9%.
While the completion rate for surveys fielded by live calls was 1.1%.
The completion rate for the in-person intercept surveys is unknown as respondent candidates who were either approached to participate in the survey, but chose not to do so, or did not qualify to participate were not enumerated.
2016
Survey respondents were 3,003 NYC residents aged 18 and older. The survey was conducted from August 2 – August 18, 2016 using a multi-modal methodology, which included IVR (automated) phone calls to landline telephones, live phone calls to cellular telephones, and in-person intercept interviews.
The margin of error for the overall sample is +/- 1.79%.
The margin of error by borough is as follows:
- The Bronx +/- 4.3%
- Brooklyn +/-3.2%
- New York +/- 4.1%
- Queens +/- 3.4%
- Staten Island +/- 7.3%
The completion rate for the surveys fielded by IVR calls was 1.8%.
The completion rate for surveys fielded by live calls was 1.1%.
The completion rate for the in-person intercept surveys is unknown as respondent candidates who were either approached to participate in the survey, but chose not to do so, or did not qualify to participate were not enumerated.
2015
Survey respondents were 3,080 NYC residents age 18 and older. The survey was conducted from July 18 – July 31, 2015 using a multi-modal methodology, which included IVR (automated) phone calls to landline telephones, live phone calls to cellular telephones, and in-person intercept interviews.
The margin of error for the overall sample is +/- 1.77%.
The margin of error by borough is as follows:
- The Bronx +/- 4.8%
- Brooklyn +/- 3.2%
- Manhattan +/- 3.9%
- Queens +/- 3.5%
- Staten Island +/- 6.0%
The completion rate for the surveys fielded by IVR calls was 1.7%.
The completion rate for surveys fielded by live calls was 1.2%.
The completion rate for the in-person intercept surveys is unknown as respondent candidates who were either approached to participate in the survey, but chose not to do so, or did not qualify to participate were not enumerated.